Notch Filter Bode Plot not what I expected?

Thread Starter

SamR

Joined Mar 19, 2019
5,039
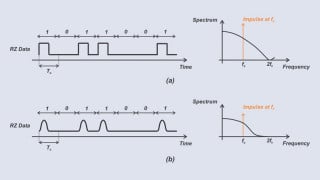
33uH and 100uH inductors plotted from 100kHz to 1.5MHz in 50kHz increments. Using Cleqee JDS6600-60M function generator. Kinda looks like a plot, but slopes look wrong. The fr is about what I calculated. fr=1/2π√LC =~500K for 100uH and =~880kHz for 33uH. At resonance, the Vs also dropped? Is that right? This is not the plot I expected, but is it right? As the frequenqy passed resonance the sine wave appeared to invert? Does it or was it just an illusion?

Thanks, Sam

Should I have posted this elsewhere?


IMG_0391.JPG filter.png
 

Attachments

crutschow

Joined Mar 14, 2008
34,408
It's fine to post here.
Below is the LTspice simulation of your circuit with 100μH.
The output goes close to zero at resonance, since that is where the inductive reactance equals the capacitive reactance, which then cancel each other, so the series impedance drops to the inductor resistance.
Based upon the minimum voltage you observed I assume the inductor resistance was about 6Ω.
Note the reversal in phase at the null point, as you observed.
(I assume those are 10:1 probes)?

upload_2019-4-2_15-49-23.png
 

Thread Starter

SamR

Joined Mar 19, 2019
5,039
Yes, the probes are set for 10X. That plot is what I expected! I knew about phase lead/lag and the inductor's r effect on fr voltage, but not the phase inversion. The "bowed in" slope leading up to fr puzzles me and then the almost straight line after fr. Played with this for a couple of days both manually adjusting f and using the function generator's sweep mode for the frequency at various rates and generating CSV files to plot. OK I'm still somewhat puzzled by the strange shaped plot I got, but thanks for confirming that I was somewhat in the ball park for me . These plots were generated by manually sweeping so I will go back auto sweeping and see if the CSV data gives me better resolution.

Thanks, Sam
 

Thread Starter

SamR

Joined Mar 19, 2019
5,039
It's been a week of firsts for me. I'm getting converted to LTspice and need some help setting up the analysis for this. Have several other types of filter circuits I'm learning and would like to model them. What are the Out and Rser=50 in the schematic?

Annotation 2019-04-02 223643.png
 

crutschow

Joined Mar 14, 2008
34,408
What are the Out and Rser=50 in the schematic?
Out is the node (Net) designation.
Press F4 and write in the desired node name.
Then attach it to the wire node.
Right click to change its name.

upload_2019-4-2_19-46-14.png ------------upload_2019-4-2_19-54-23.png

Rser=50 is the voltage source (generator) series resistance.
You set it by right-clicking on the source and entering the value in Parasitic Properties -- Series Resistance.

upload_2019-4-2_19-50-55.png
 

Thread Starter

SamR

Joined Mar 19, 2019
5,039
Thanks! I'm with you so far, but the parasitic Ω is for which device? The function generator? What is this "Independent Voltage Source-V1" Function PULSE(V1 V2 T delay etc.? Not a SINE? I'm losing it here...
 

crutschow

Joined Mar 14, 2008
34,408
Thanks! I'm with you so far, but the parasitic Ω is for which device? The function generator? What is this "Independent Voltage Source-V1" Function PULSE(V1 V2 T delay etc.? Not a SINE? I'm losing it here...
The parasitic resistance is the generator source resistance.

Sorry, I picked a different voltage source to illustrate and it was set to output a pulse, not a sinewave.

Edit: Here's the source with an AC voltage value specified:
upload_2019-4-3_13-49-27.png
 
Last edited:
Top