noise density nV/Hz vs nV/Hz

Thread Starter

praondevou

Joined Jul 9, 2011
2,942
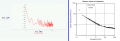
I have a csv containing noise data. Sample rate is 1ms. What I want is the graph on the right side of the below picture. What I have is the graph on the left side.

I have difficulty grasping the idea of "nV/√Hz" on the Y axis. What does that mean exactly?

And having a matrix of noise-frequency data, how do I transform nV on the Y axis into nV/√Hz?

The FFT was done in MathCad Prime, I haven't asked in their forum yet, because I think this question is more electronics related.


Attachments

Last edited:

WBahn

Joined Mar 31, 2012
33,021
Where the V/√Hz comes from is actually pretty simple.

Noise is generally best looked at in terms of power, not voltage. A given type of noise will have a certain power spectrum that is described by the noise power spectral density as a function of frequency. So if you have a certain signal that has a noise power spectral density of 1μW/Hz in the vicinity of 1MHz, then a signal that is centered at 1MHz that has a bandwidth of 10kHz would have an expected noise power content of 10mW.

Just like we do with dB, which is defined in terms of power, we find it convenient to work with voltage and so we adjust our definitions to use voltage instead of power by noting that power is proportional to the square of voltage. Thus, if we take the square root of our noise power spectral density of 1μW/Hz, we get 1mV/√Hz. The key is that we are assuming a 1Ω resistor as a normalized load.

Note that the numbers I have used in these examples are NOT realistic -- I just pulled them out of thin air to have numbers that are easy to work with.
 

Tesla23

Joined May 10, 2009
560
I have a csv containing noise data. Sample rate is 1ms. What I want is the graph on the right side of the below picture. What I have is the graph on the left side.

I have difficulty grasping the idea of "nV/√Hz" on the Y axis. What does that mean exactly?

And having a matrix of noise-frequency data, how do I transform nV on the Y axis into nV/√Hz?

The FFT was done in MathCad Prime, I haven't asked in their forum yet, because I think this question is more electronics related.
If you change the number of samples in your FFT, then the magnitude of the output will change. For example if you double the number of samples, the FFT of your data is now representing your noise using twice the number of sinusoids, so on average each will be 3dB lower (to give the same power). Another way of thinking about this is that the frequency 'bins' in the FFT output are now only half as wide, so on average have only half the noise power in each.

If your sample rate is Fs and you have Ns samples for the FFT, then (assuming no windowing) the each bin in the FFT output represent the signal in a filter Fs/Ns wide. To find the signal in a 1Hz wide filter, divide the power by Fs/Ns, or divide the amplitide by √(Fs/Ns). If you do this the output will be in V/√Hz and will not change as you change the number of samples in the FFT.

Of course, this only works for noise, if you have a discrete spectral line your shouldn't scale it.
 

Tesla23

Joined May 10, 2009
560
The other thing you need to do is check the scaling of the FFT. Typical FFT algorithms express your samples \(x_n\) as

\(x_n = \frac{1}{N}\sum X_k e^{j2\pi kn/N}\)

whereas what you really want is:

\(x_n = \sum C_k e^{j2\pi kn/N}\)

i.e. actually represent the time samples as a sum of sinusoids, where the \(C_k = \frac{X_k}{N}\) are your actual filter outputs, so you may need to fix the scaling.
 
Top