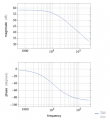
LT Spice Bode Plot

Thread Starter

kalemaxon89

Joined Oct 12, 2022
264
I simulated this circuit on LTSpice.

From the calculations I get this transfer function:
Vo(s)/Vi(s) = 1/( sCR+(Rload+R)/Rload ) = 1/( 1/10000*s+6/5 ) (by choosing Rload = 5h, R = 1k, C = 100nF)
In the simulation I gave as input a step function to find the final value (Which turns out to be the same as I calculated).

1) If I want to plot the bode diagram, do I have to put a sine wave in the input or a step function also okay?
By maintaining a step function, I get:
1714037853062.png

The problem is that on wolframalpha I get:
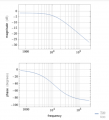
1714038037508.png

I am probably doing something wrong on LTSpice ... I attach the file for your suggestion.
 

Attachments

LvW

Joined Jun 13, 2013
1,783
1) If I want to plot the bode diagram, do I have to put a sine wave in the input or a step function also okay?
By maintaining a step function, I get:
* If you command an ac analysis (Bode plot) the program does react upon an ac source only.
That means: The step function will be completely ignored because it applies for the time analysis only.

* When choosing Vac=3V you must display dB(Vout)/dB(Vin). For Vac=1V it is sufficient to diplay dB(Vout) only.
 

Thread Starter

kalemaxon89

Joined Oct 12, 2022
264
* If you command an ac analysis (Bode plot) the program does react upon an ac source only.
That means: The step function will be completely ignored because it applies for the time analysis only.

* When choosing Vac=3V you must display dB(Vout)/dB(Vin). For Vac=1V it is sufficient to diplay dB(Vout) only.
hi k89,
If you want to see a 'true' dB plot, you should use AC=1 not 3, try it.
E
View attachment 320699
Thank you for your response.

1) With AC 3, If I do as @LvW suggests, at DC it doesn't start from 0dB the curve:
1714054147323.png


2) From the graph of @ericgibbs I noticed the changing of the dB at DC, rightly now it is 0dB and not 8dB as in the wrong simulation picture in my main post. However, this does not explain why at 10kHz I have -15dB while on wolframalpha I have -3dB about
 

crutschow

Joined Mar 14, 2008
34,905
Not sure of your question.

R1 and R2 form a voltage divider which gives a -1.5dB attenuation at DC (or at frequencies well below the corner frequency).

LTspice references the Bode plot gain to 1V, so that's why 1V is normally used to give 0db for a gain of 1.
 

Thread Starter

kalemaxon89

Joined Oct 12, 2022
264
Not sure of your question.

R1 and R2 form a voltage divider which gives a -1.5dB attenuation at DC (or at frequencies well below the corner frequency).

LTspice references the Bode plot gain to 1V, so that's why 1V is normally used to give 0db for a gain of 1.
With Laplace, I get this transfer function: Vo/Vi = 1/[sC + (Rload+R)/(Rload*R)] = 1/[s*100n + 6/5k]

Here is the Bode diagram of the circuit with R=1k, C=100nF and Rload=5k:

1) Using wolframalpha:
1714145620682.png
1714145636258.png

2) Using LTSpice: (simulation of @ericgibbs)
EG57_ 1657.png
Why here at 10kHz there are -15dB (-13dB attenuation from the -2dB at DC) while on wolframalpha at 10kHz attenuation I have from 57dB (-3dB attenuation from the DC) ??
 

crutschow

Joined Mar 14, 2008
34,905
Why here at 10kHz there are -15dB (-13dB attenuation from the -2dB at DC) while on wolframalpha at 10kHz attenuation I have from 57dB (-3dB attenuation from the DC) ??
There seems to be a factor of 10 error in the transfer function you simulated.
The calculated -3dB corner frequency of the circuit is 2kHz but your wolframalpha plot shows it at 10kHz.
 
Top