Hey everyone,
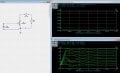
I've been stuck on this problem for a while, but I am supposed to to plot Ib vs VBE and IC Vs VCE with IB as the variable resistor using a simulator (I'm using circuit maker) for three separate transistors (2N2222A , 2N3904, 2N44401)). I have set up a circuit to bias the transistor with VCE- 5V and Ic=1mA, however, the graphs I am getting do not seem to make sense. I've tried to put a current source of 1mA at the base and voltage source at the collector to find the IC vs VCE and then a 10V voltage source at the base and a 5V voltage source with a 1k resistor at the collector to find the Ib VS VBE. However, none of the graphs seem to make sense to me and seem very different than what it should be looking like. It would be so great if someone can help me out! All help is appreciated")
I've been stuck on this problem for a while, but I am supposed to to plot Ib vs VBE and IC Vs VCE with IB as the variable resistor using a simulator (I'm using circuit maker) for three separate transistors (2N2222A , 2N3904, 2N44401)). I have set up a circuit to bias the transistor with VCE- 5V and Ic=1mA, however, the graphs I am getting do not seem to make sense. I've tried to put a current source of 1mA at the base and voltage source at the collector to find the IC vs VCE and then a 10V voltage source at the base and a 5V voltage source with a 1k resistor at the collector to find the Ib VS VBE. However, none of the graphs seem to make sense to me and seem very different than what it should be looking like. It would be so great if someone can help me out! All help is appreciated
Attachments
-
 69.3 KB Views: 301