Facebook
 Google
 GitHub
 Linkedin
Hi!
First let me set the stage for my question:
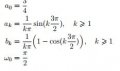
I'm writing a report on lowpass fitlers and Fourier series. I have a filter with the transferfunction H(w) = a/(jw+a) and a signal that can be described by the fourier series as shown in the picture "fourier square".
First i plot the fourierseries through the filter in MATLAB and varied the value for a, and as expected the bigger the a, the bigger the frequency content. You can se the result for a=10 in the picture "a=10"
I then did the same thing in simulink, the same square signal and the same filter, and at first i was not suprised at all about the result seen in picture "scope a10".
But as i sat down starting to think about it i realised, why doesen't the plot and the scope image look the same?
I mean, i filter out some frequency components of the square wave in both cases..? And for the same filter and same value of a it should be the same frequency components.
I realise this probably is a case theory vs. reality, but i cant wrap my head around it..
The reason i didn't think of it as something "strange" at first is that all the time i was thinking of it as a simple RC filter and seeing the output as the charge and discharge of the capacitor having in mind that it nowhere said that it actually is a RC-filter.
What is happening here, why cant we se the harmonics in the real world case? are they just very attenuated?
So basically my question is: Why does the two prctures differ when they describe the same situation?
Thank You!
First let me set the stage for my question:
I'm writing a report on lowpass fitlers and Fourier series. I have a filter with the transferfunction H(w) = a/(jw+a) and a signal that can be described by the fourier series as shown in the picture "fourier square".
First i plot the fourierseries through the filter in MATLAB and varied the value for a, and as expected the bigger the a, the bigger the frequency content. You can se the result for a=10 in the picture "a=10"
I then did the same thing in simulink, the same square signal and the same filter, and at first i was not suprised at all about the result seen in picture "scope a10".
But as i sat down starting to think about it i realised, why doesen't the plot and the scope image look the same?
I mean, i filter out some frequency components of the square wave in both cases..? And for the same filter and same value of a it should be the same frequency components.
I realise this probably is a case theory vs. reality, but i cant wrap my head around it..
The reason i didn't think of it as something "strange" at first is that all the time i was thinking of it as a simple RC filter and seeing the output as the charge and discharge of the capacitor having in mind that it nowhere said that it actually is a RC-filter.
What is happening here, why cant we se the harmonics in the real world case? are they just very attenuated?
So basically my question is: Why does the two prctures differ when they describe the same situation?
Thank You!
Attachments
-
 35.9 KB Views: 11
 -
 20.8 KB Views: 11
 -
 12.3 KB Views: 13