Facebook
 Google
 GitHub
 Linkedin

1. The problem statement, all variables and given/known data
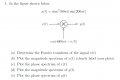
See figure attached.
2. Relevant equations
3. The attempt at a solution
See pdf attached for my attempt at the solution.
I'm a little confused as to how to draw the phase spectrum for y(t). Would it simply be a line equation of,
\(-\frac{\pi}{6000}f \pm \frac{\pi}{2}\)
for each given triangle?(the +/- is selected accordingly of course)
Aside from that, are there any other mistakes?
Cheers!
See figure attached.
2. Relevant equations
3. The attempt at a solution
See pdf attached for my attempt at the solution.
I'm a little confused as to how to draw the phase spectrum for y(t). Would it simply be a line equation of,
\(-\frac{\pi}{6000}f \pm \frac{\pi}{2}\)
for each given triangle?(the +/- is selected accordingly of course)
Aside from that, are there any other mistakes?
Cheers!
Attachments
-
 62.6 KB Views: 20
 -
1.1 MB Views: 16