Bode Plot - Phase shift

Thread Starter

Simon.palm4

Joined Apr 28, 2016
6
Hi. I'am having trouble understanding how to draw the phase of a bipolar transistor amplifier.

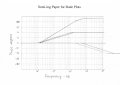
The transferfunction looks as the enclosed file1.

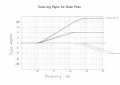
I have drawn the normalized amplitude according to enclosed file2.

The task is to draw the phase diagram and calculate at which frequency the phase is close to 45 degrees.

Any suggestions on how to proceed?

Thanks, Simon.
 

Attachments

Thread Starter

Simon.palm4

Joined Apr 28, 2016
6
Given a transfer function do you know how to write an expression for the phase?
No I don't. What I thought was the way to go were to mark my cut off frequencies (100,130,20k and 50k) in this case +45 deg at 100 and 130, and -45 deg at 20k and 50k. Then summarize the results into one resultant. Does it give a better picture of the function by writing the expression for the phase?
 

Thread Starter

Simon.palm4

Joined Apr 28, 2016
6
Yes it does. It also allows you to see the effect of the various terms. If you have access to Matlab or one of the free clones you can use that to check your results. Check out the following:

http://lpsa.swarthmore.edu/Bode/BodeExamples.html
Thanks for the link, I have checked it out but I'am having a hard time to rewrite my transferfunction. But get if from the examples that I have one constant at 20log(160)=44 dB, one zero at 100 hz and one zero at 130 hz, one pole at 20k hz and one pole at 50k hz.

Am I understanding it correct or do I have to rewrite my transfer function with both the lowest order term in the numerator and denominator unity?
 

Papabravo

Joined Feb 24, 2006
21,228
What you missed from the article is that you need to make a composite from the four components, since they interact with each other.
 

Papabravo

Joined Feb 24, 2006
21,228
Can you confirm that the final value of the phase shift is greater than 180°. What is the final value of the phase shift
 

RBR1317

Joined Nov 13, 2010
714
In the old days we were taught to sketch the Bode plot given the corner frequencies from the transfer function. But now we have software that will compute and plot the magnitude & phase of a transfer function. So there is no good reason to do it manually anymore (unless you are taking a test on your ability to manually sketch Bode plots).

Here is a plot of the magnitude & phase of the given transfer function from Mathcad-15. Waterloo Maple also has a BodePlot function but I'm still learning how to use Maple.
Bode_bipolarTr.png
 

Thread Starter

Simon.palm4

Joined Apr 28, 2016
6
Can you confirm that the final value of the phase shift is greater than 180°. What is the final value of the phase shift
No I can't confirm that because I still don't understand what I am doing..
In the old days we were taught to sketch the Bode plot given the corner frequencies from the transfer function. But now we have software that will compute and plot the magnitude & phase of a transfer function. So there is no good reason to do it manually anymore (unless you are taking a test on your ability to manually sketch Bode plots).

Here is a plot of the magnitude & phase of the given transfer function from Mathcad-15. Waterloo Maple also has a BodePlot function but I'm still learning how to use Maple.
View attachment 112473
Well I have to learn to do I on paper incase one of these shows up on my exam where I don't have access to matlab. But why are you taking the absolute value of the function?
 

Papabravo

Joined Feb 24, 2006
21,228
No I can't confirm that because I still don't understand what I am doing..


Well I have to learn to do I on paper incase one of these shows up on my exam where I don't have access to matlab. But why are you taking the absolute value of the function?
In this context the vertical bars are not telling you to take the "absolute value", they are telling you to take the magnitude. Complex value functions can be expressed in multiple ways. The first way they can be expressed is in Cartesian Coordinates like:

\(z = x + jy\)

The second way is in Polar Coordinates which looks like a magnitude and an angle. The angle is sometime referred to as the argument or arg for short. Way back in my first post I suggested that you come up with an expression that you could use for evaluating this function. I fear that your ad hoc construction rules have led you astray. At least now you have the expression, and you can see how it was created.
 
Top