
Hi. I'm new in this great forum.
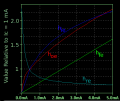
I can't find the way to obtain a graphic of hibrid BJT parameters, as one can see in some datasheet. I attach a picture what I need. but I don't need all plots parametrized in only one graphic. It can be a graphic for each parameter (i.e., one for hie, another for hoe, etc). all of them as a function of collector current.
I've tried with .TF command, and with .NET command in an AC analisys, but no results.
Could any of you please help me?
Regards,
Daniel
Attachments
-
 4.6 KB Views: 23


